『正文』
ˇ
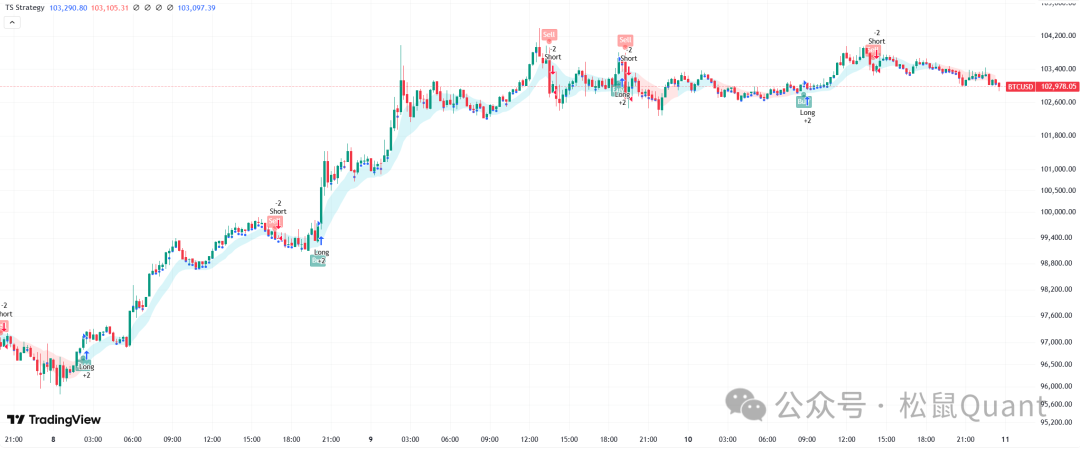
 //@version=5strategy("Trend Signals Strategy", shorttitle="TS Strategy", overlay=true, pyramiding=0)// Input parameterssrc = input(hl2, title="Source", group="Strategy Settings")Multiplier = input.float(2.0, title="Sensitivity (0.5 - 5)", step=0.1, minval=0.5, maxval=5.0, group="Strategy Settings")atrPeriods = input.int(10, title="ATR Length", group="Strategy Settings")atrCalcMethod = input.string("Method 1", title="ATR Calculation Methods", options=["Method 1", "Method 2"], group="Strategy Settings")cloud_val = input.int(10, title="Cloud Moving Average Length", minval=5, maxval=500, group="Strategy Settings")stopLossVal = input.float(2.0, title="Stop Loss Percent", minval=0.0, group="Strategy Settings")showBuySellSignals = input.bool(true, title="Show Buy/Sell Signals", group="Strategy Settings")showMovingAverageCloud = input.bool(true, title="Show Cloud MA", group="Strategy Settings")// Calculationspercent(nom, div) => 100 * nom / divsrc1 = ta.hma(open, 5)[1]src2 = ta.hma(close, 12)momm1 = ta.change(src1)momm2 = ta.change(src2)f1(m, n) => m >= n ? m : 0.0f2(m, n) => m >= n ? 0.0 : -mm1 = f1(momm1, momm2)m2 = f2(momm1, momm2)sm1 = math.sum(m1, 1)sm2 = math.sum(m2, 1)cmoCalc = percent(sm1 - sm2, sm1 + sm2)hh = ta.highest(2)h1 = na(hh) ? na : hhvar float hpivot = nahpivot := na(h1) ? hpivot : h1ll = ta.lowest(2)l1 = na(ll) ? na : llvar float lpivot = nalpivot := na(l1) ? lpivot : l1rsiCalc = ta.rsi(close, 9)lowPivot = lpivothighPivot = hpivotsup = rsiCalc < 25 and cmoCalc > 50 and lowPivotres = rsiCalc > 75 and cmoCalc < -50 and highPivotatr2 = ta.sma(ta.tr, atrPeriods)atr = atrCalcMethod == "Method 1" ? ta.atr(atrPeriods) : atr2up = src - (Multiplier * atr)up1 = nz(up[1], up)up := close[1] > up1 ? math.max(up, up1) : updn = src + (Multiplier * atr)dn1 = nz(dn[1], dn)dn := close[1] < dn1 ? math.min(dn, dn1) : dnvar int trend = 1trend := nz(trend[1], trend)trend := trend == -1 and close > dn1 ? 1 : trend == 1 and close < up1 ? -1 : trendbuySignal = trend == 1 and trend[1] == -1sellSignal = trend == -1 and trend[1] == 1longCond = buySignalshortCond = sellSignal// Entry price calculationsentryOfLongPosition = ta.valuewhen(longCond, close, 0)entryOfShortPosition = ta.valuewhen(shortCond, close, 0)sl = stopLossVal > 0 ? stopLossVal / 100 : 99999stopLossForLong = entryOfLongPosition * (1 - sl)stopLossForShort = entryOfShortPosition * (1 + sl)takeProfitForLong1R = entryOfLongPosition * (1 + sl)takeProfitForShort1R = entryOfShortPosition * (1 - sl)takeProfitForLong2R = entryOfLongPosition * (1 + sl * 2)takeProfitForShort2R = entryOfShortPosition * (1 - sl * 2)takeProfitForLong3R = entryOfLongPosition * (1 + sl * 3)takeProfitForShort3R = entryOfShortPosition * (1 - sl * 3)// Strategy executionif longCond strategy.entry("Long", strategy.long) if stopLossVal > 0 strategy.exit("X-Long", "Long", stop=stopLossForLong, limit=takeProfitForLong3R, alert_message="Long Exit: {{ticker}} | {{close}}")if shortCond strategy.entry("Short", strategy.short) if stopLossVal > 0 strategy.exit("X-Short", "Short", stop=stopLossForShort, limit=takeProfitForShort3R, alert_message="Short Exit: {{ticker}} | {{close}}")// Position reversal when stop loss disabledif stopLossVal <= 0 if longCond and strategy.position_size < 0 strategy.close("Short", comment="Reverse Long") if shortCond and strategy.position_size > 0 strategy.close("Long", comment="Reverse Short")// Visual elementschangeCond = trend != trend[1]smaSrcHigh = ta.ema(high, cloud_val)smaSrcLow = ta.ema(low, cloud_val)[macdLine, signalLine, histLine] = ta.macd(close, 12, 26, 9)plot_high = plot(showMovingAverageCloud ? smaSrcHigh : na, color=color.new(color.blue, 100), editable=false)plot_low = plot(showMovingAverageCloud ? smaSrcLow : na, color=color.new(color.red, 100), editable=false)plotshape(longCond ? up : na, title="UpTrend Begins", location=location.belowbar, style=shape.circle, size=size.tiny, color=color.new(color.teal, 50))plotshape(longCond and showBuySellSignals ? up : na, title="Buy", text="Buy", location=location.belowbar, style=shape.labelup, size=size.tiny, color=color.new(color.teal, 50), textcolor=color.white)plotshape(shortCond ? dn : na, title="DownTrend Begins", location=location.abovebar, style=shape.circle, size=size.tiny, color=color.new(color.red, 50))plotshape(shortCond and showBuySellSignals ? dn : na, title="Sell", text="Sell", location=location.abovebar, style=shape.labeldown, size=size.tiny, color=color.new(color.red, 50), textcolor=color.white)fill(plot_high, plot_low, color=(macdLine > 0) and (macdLine > macdLine[1]) ? color.new(color.aqua, 85) : na, title="Positive Cloud Uptrend")fill(plot_high, plot_low, color=macdLine > 0 and macdLine < macdLine[1] ? color.new(color.aqua, 85) : na, title="Positive Cloud Downtrend")fill(plot_high, plot_low, color=macdLine < 0 and macdLine < macdLine[1] ? color.new(color.red, 85) : na, title="Negative Cloud Uptrend")fill(plot_high, plot_low, color=macdLine < 0 and macdLine > macdLine[1] ? color.new(color.red, 85) : na, title="Negative Cloud Downtrend")plot(ohlc4, title="", style=plot.style_circles, linewidth=1)// Alert messages for entriesalertLongText = "{\"action\": \"BUY\", \"symbol\": \"" + syminfo.ticker + "\", \"entry\": " + str.tostring(entryOfLongPosition) + ", \"stop_loss\": " + str.tostring(stopLossForLong) + ", \"tp1\": " + str.tostring(takeProfitForLong1R) + ", \"tp2\": " + str.tostring(takeProfitForLong2R) + ", \"tp3\": " + str.tostring(takeProfitForLong3R) + "}"alertShortText = "{\"action\": \"SELL\", \"symbol\": \"" + syminfo.ticker + "\", \"entry\": " + str.tostring(entryOfShortPosition) + ", \"stop_loss\": " + str.tostring(stopLossForShort) + ", \"tp1\": " + str.tostring(takeProfitForShort1R) + ", \"tp2\": " + str.tostring(takeProfitForShort2R) + ", \"tp3\": " + str.tostring(takeProfitForShort3R) + "}"// Generate alertsif longCond alert(alertLongText, alert.freq_once_per_bar_close) if shortCond alert(alertShortText, alert.freq_once_per_bar_close)// Trend change alertalertcondition(changeCond, title="Trend Direction Change", message="Trend direction has changed!")接下来让Ai帮我们转化到松鼠Quant回测框架内,我们不需要写一行代码!!!
github地址(国外):
https://github.com/songshuquant/ssquant-ai
gitee地址(国内):
https://gitee.com/ssquant/ssquant-ai
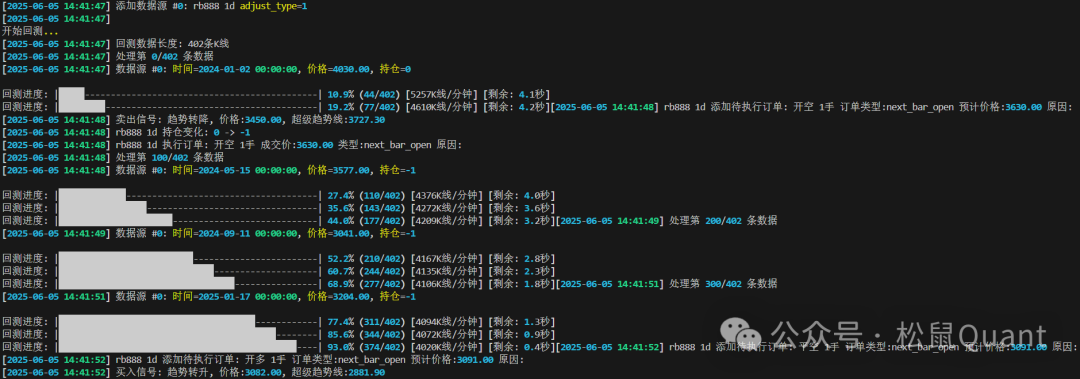
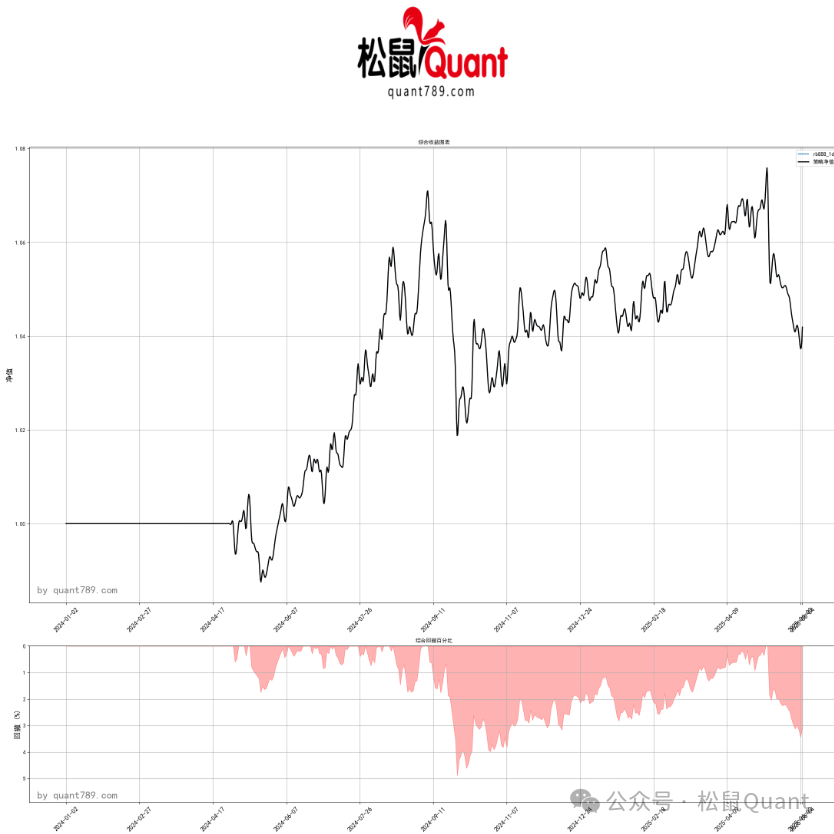
import pandas as pdimport numpy as npfrom ssquant.backtest.multi_source_backtest import MultiSourceBacktesterfrom ssquant.api.strategy_api import StrategyAPIdef initialize(api: StrategyAPI): api.log("超级趋势线策略初始化") def calculate_supertrend(high, low, close, atr_period=10, multiplier=3): """ 计算超级趋势线指标 参数: high: 最高价序列 low: 最低价序列 close: 收盘价序列 atr_period: ATR计算周期 multiplier: ATR乘数 返回: supertrend: 超级趋势线值 direction: 趋势方向(1为上升趋势,-1为下降趋势) """ tr = pd.DataFrame({ 'high-low': high - low, 'high-prev_close': abs(high - close.shift(1)), 'low-prev_close': abs(low - close.shift(1)) }).max(axis=1) atr = tr.rolling(atr_period).mean() hl2 = (high + low) / 2 upper_band = hl2 + multiplier * atr lower_band = hl2 - multiplier * atr supertrend = pd.Series(np.nan, index=close.index) direction = pd.Series(1, index=close.index) for i in range(1, len(close)): if close.iloc[i] > upper_band.iloc[i-1]: direction.iloc[i] = 1 elif close.iloc[i] < lower_band.iloc[i-1]: direction.iloc[i] = -1 else: direction.iloc[i] = direction.iloc[i-1] if direction.iloc[i] == 1: supertrend.iloc[i] = lower_band.iloc[i] else: supertrend.iloc[i] = upper_band.iloc[i] return supertrend, directiondef strategy_function(api: StrategyAPI): atr_period = api.get_param('atr_period', 10) multiplier = api.get_param('multiplier', 3) current_idx = api.get_idx() if current_idx < atr_period + 1: return high = api.get_high() low = api.get_low() close = api.get_close() if high is None or low is None or close is None: api.log("警告: 数据为空") return supertrend, direction = calculate_supertrend(high, low, close, atr_period, multiplier) current_direction = direction.iloc[current_idx] prev_direction = direction.iloc[current_idx - 1] current_pos = api.get_pos() if prev_direction == -1 and current_direction == 1: if current_pos <= 0: api.close_all(order_type='next_bar_open') api.buy(volume=1, order_type='next_bar_open') api.log(f"买入信号: 趋势转升, 价格:{close.iloc[current_idx]:.2f}, 超级趋势线:{supertrend.iloc[current_idx]:.2f}") elif prev_direction == 1 and current_direction == -1: if current_pos >= 0: api.close_all(order_type='next_bar_open') api.sellshort(volume=1, order_type='next_bar_open') api.log(f"卖出信号: 趋势转降, 价格:{close.iloc[current_idx]:.2f}, 超级趋势线:{supertrend.iloc[current_idx]:.2f}")if __name__ == "__main__": try: from ssquant.config.auth_config import get_api_auth API_USERNAME, API_PASSWORD = get_api_auth() except ImportError: print("警告:未找到 auth_config.py 文件,请在下方填写您的认证信息:API_USERNAME和API_PASSWORD") API_USERNAME = "" API_PASSWORD = "" backtester = MultiSourceBacktester() backtester.set_base_config({ 'username': API_USERNAME, 'password': API_PASSWORD, 'use_cache': True, 'save_data': True, 'align_data': False, 'fill_method': 'ffill', 'debug': True }) backtester.add_symbol_config( symbol='rb888', config={ 'start_date': '2024-01-01', 'end_date': '2025-12-31', 'initial_capital': 100000.0, 'commission': 0.0003, 'margin_rate': 0.1, 'contract_multiplier': 10, 'periods': [ {'kline_period': '1d', 'adjust_type': '1'}, ] } ) results = backtester.run( strategy=strategy_function, initialize=initialize, strategy_params={ 'atr_period': 10, 'multiplier': 3 }, )没错,整个开发过程我们没有写一行代码,松鼠QuantAi助手会编写,回测,分析,修改。基于松鼠Quant的MCP服务器+Deepseek开启全新量化学习的路径,即使0基础也能完成策略的编写与验证!如果你喜欢这个系列,请点赞,转发,在看三连。我们根据受欢迎程度决定是否继续更新,感谢您的支持。微 信|小松鼠-松鼠Quant
微信号|viquant01